
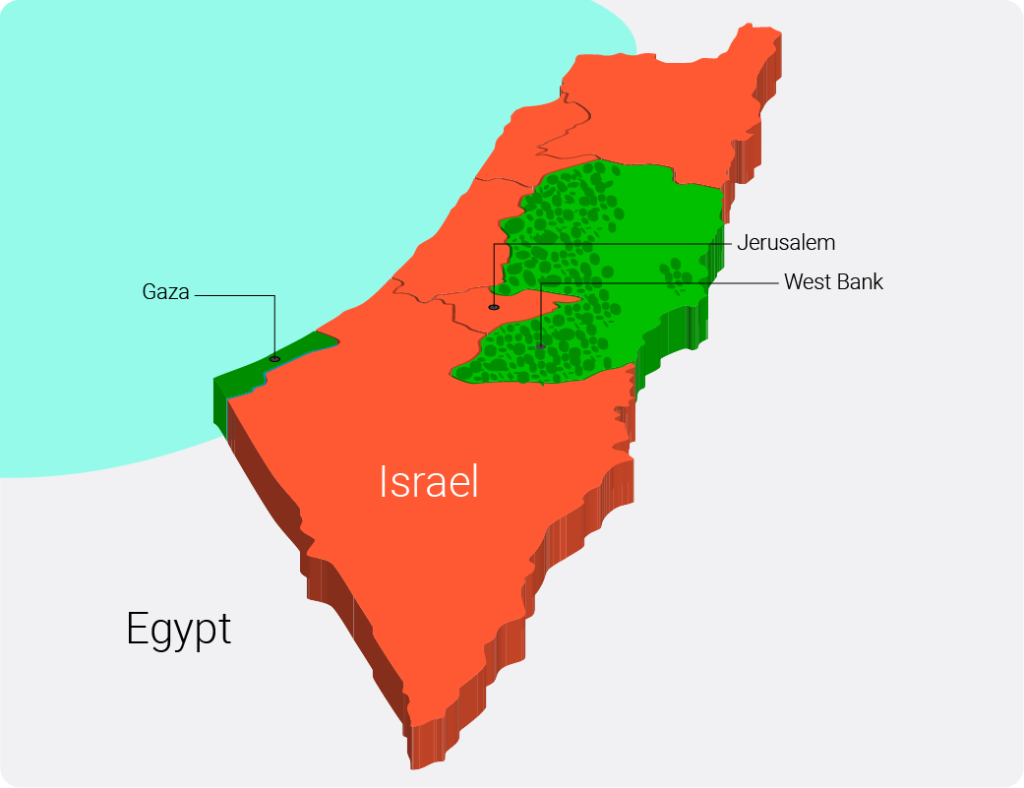
To understand the ongoing conflict between Israel and Hamas in Gaza, we need to consider the context and history. The following charts aim to provide some perspective on the changes in the region over time.
The first chart illustrates the history of Israeli settlements in the West Bank. The map shows when and where these settlements were established. Darker red colors represent more recent settlements, while pink indicates older ones. Grey dots represent settlements with unverified establishment dates. The Israeli government began promoting settlements as a policy after the 1967 Six Day War, during which Israel took control of the West Bank and Gaza from Jordan and Egypt, respectively. These settlements vary in size, with some having fewer than 100 residents, while others have grown into large towns with industrial areas. Data for this chart was collected from sources like the UN Office for the Coordination of Humanitarian Affairs (OCHA), Peace Now, and B’Tselem.

It’s essential to note that the legality of these settlements is a subject of debate. However, under international law, specifically Article 49 of the Fourth Geneva Convention, they are considered illegal.
To understand how these settlements have encroached on Palestinian land, we need to go back to the 1990s and the Oslo Accords. These agreements between the Israeli government and the Palestinian Liberation Organisation (PLO) aimed to establish control boundaries in the West Bank and Gaza. The Oslo II Accords divided the West Bank into areas controlled by Israel, the Palestinian Authority, or a joint operation. Initially, these accords were designed to facilitate the handover of territory to a future Palestinian state. However, the growth of settlements has made this prospect increasingly difficult.
The borders on the map are complex and often overlap, leading to Palestinian-controlled areas being separated from each other. The West Bank is divided into three main areas: Area A (red) under Palestinian Authority control, Area B (blue) with joint control, and Area C (green) under Israeli control, where most settlements are located. Additionally, the city of Hebron is divided into H1 (Palestinian Authority control, pink on the map) and H2 (Israeli control, yellow on the map).
Conflicts over the years have displaced many people in the Gaza Strip, leading them to seek refuge in camps and shelters managed by various organizations. Israel’s 2004 disengagement policy aimed to withdraw Israeli troops and settlements from Gaza. Before the policy, there were 21 civilian settlements in Gaza with around 8,500 Israelis. Expansion of the buffer zone at the Rafah crossing in 2000 resulted in the destruction of a third of the refugee camp there and the internal displacement of 16,000 Palestinians.

The chart below illustrates the recent increase in internally displaced people in UN Relief and Works Agency-run shelters in Gaza during October. The surge in the Deir al Balah, Rafah, and Khan Younis areas, all in the southern end of Gaza, occurred after Israel instructed residents in northern Gaza to move to the south. Many expected that Egypt might open its borders at Rafah. Since Hamas’ attack on October 7, which initiated the recent hostilities, there has been a notable increase in conflict events in Gaza and the West Bank, as shown on the map below. The data is sourced from the Armed Conflict Location & Event Data Project, a US-based organization that gathers information on crisis events, including violence and protests.
Please note that data tracking is slightly delayed due to the rapidity of recent events. Additionally, there has been an upward trend in incidents involving healthcare workers in Israel and the Palestinian territories, with the tragic blast at al-Ahli Arab Hospital on October 18 being the latest example. This data is sourced from OCHA and focuses on the four main perpetrators.
Understanding this context and history is crucial to comprehending the ongoing conflict in the region.